Project: UPI Daily Spend Tracker
UPI Daily Spend Tracker: Turning Daily Bank Alerts into Real-Time Analytics
A real-life problem, solved with data engineering, APIs, Python, ClickHouse, and Grafana.
Why I Built This Project
Like most people in India, a large part of my daily spending happens via UPI — small but frequent transactions across multiple merchants, apps, and bank accounts.
While banks and UPI apps show recent transactions, I felt a few gaps in my day-to-day life:
-
No single place to see daily spend trends
-
No easy way to answer:
-
Where did my money go today?
-
Which merchant do I spend the most on?
-
-
No analytics, just raw transactions
-
No historical view that felt visual and actionable
At the same time, I wanted to:
-
Solve a real problem from my daily life
-
Build something production-like
-
Use modern data + infra tooling
-
Learn by actually running the system end-to-end
-
That’s how the UPI Daily Spend Tracker was born.
High-Level Architecture
At a high level, the system looks like this:
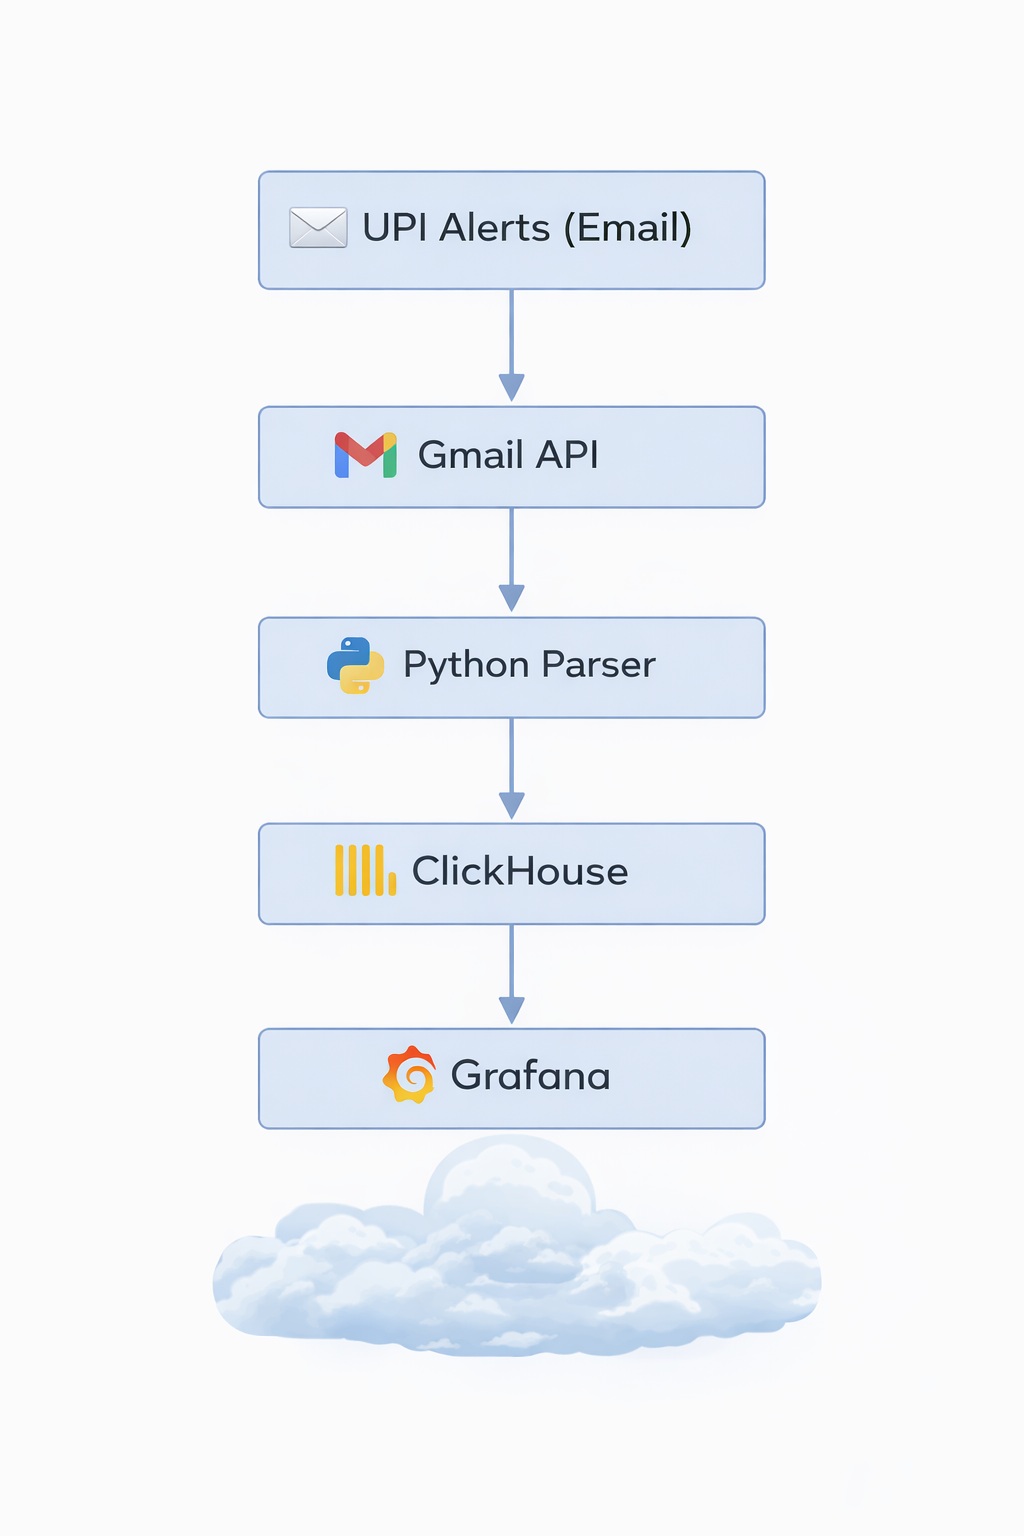
And everything runs on my self-hosted home server (An old intel Mac running 24*7 with the help of Amphetamine app), secured with HTTPS and can only be accessed using Tailscale VPN
Exposing the Project Securely (DuckDNS + HTTPS)
Since this runs on my home server, the first challenge was safe external access.
What I did:
-
Used DuckDNS to get a stable DNS name for my home server
-
Set up Nginx as a reverse proxy
-
Enabled HTTPS using Let’s Encrypt
-
Used Tailscale VPN
This gave me:
-
A proper DNS name instead of IPs
-
Encrypted access to Grafana
-
A setup very similar to real-world deployments
This step alone taught me a lot about:
-
TLS termination
-
Reverse proxying internal services
-
Running production-like infra at home
Authenticating with Gmail (Google OAuth)
All UPI alerts land in my Gmail inbox, so Gmail became my source of truth.
Challenges:
-
Gmail APIs require OAuth
-
Tokens expire
-
Refresh tokens must be handled carefully
What I implemented:
-
Google OAuth flow to generate:
-
Access token
-
Refresh token
-
-
Securely stored the refresh token
-
Automatically refreshed access tokens when needed
Once this was in place, the system could:
-
Access Gmail programmatically
-
Run without manual intervention
Fetching Only Relevant UPI Emails
Instead of scraping everything, I kept it clean.
Strategy:
-
Created Gmail labels for UPI transaction alerts
-
Used Gmail API queries to fetch:
-
Only labeled emails
-
Only new emails since last run
-
This made the ingestion:
-
Efficient
-
Predictable
-
Idempotent
Parsing Emails into Structured Data
UPI alert emails are semi-structured, not clean JSON.
So the parser extracts:
-
Transaction amount
-
Merchant name
-
Account / bank
-
Timestamp
-
Transaction type (debit / credit)
This part was surprisingly fun — and very realistic:
-
Regex + heuristics
-
Handling different bank formats
-
Guarding against partial failures
At the end of this step, every transaction becomes a clean event.
Storing Data in ClickHouse
For analytics, I chose ClickHouse.
Why ClickHouse?
-
Columnar
-
Extremely fast for aggregates
-
Perfect for time-series analytics
-
Very low operational overhead
Schema highlights:
-
Date
-
Merchant
-
Amount
-
Account
-
Transaction direction
Once data landed here, queries like:
-
“Total spend today”
-
“Top merchants this month”
-
“Daily spend trend”
became trivial and fast.
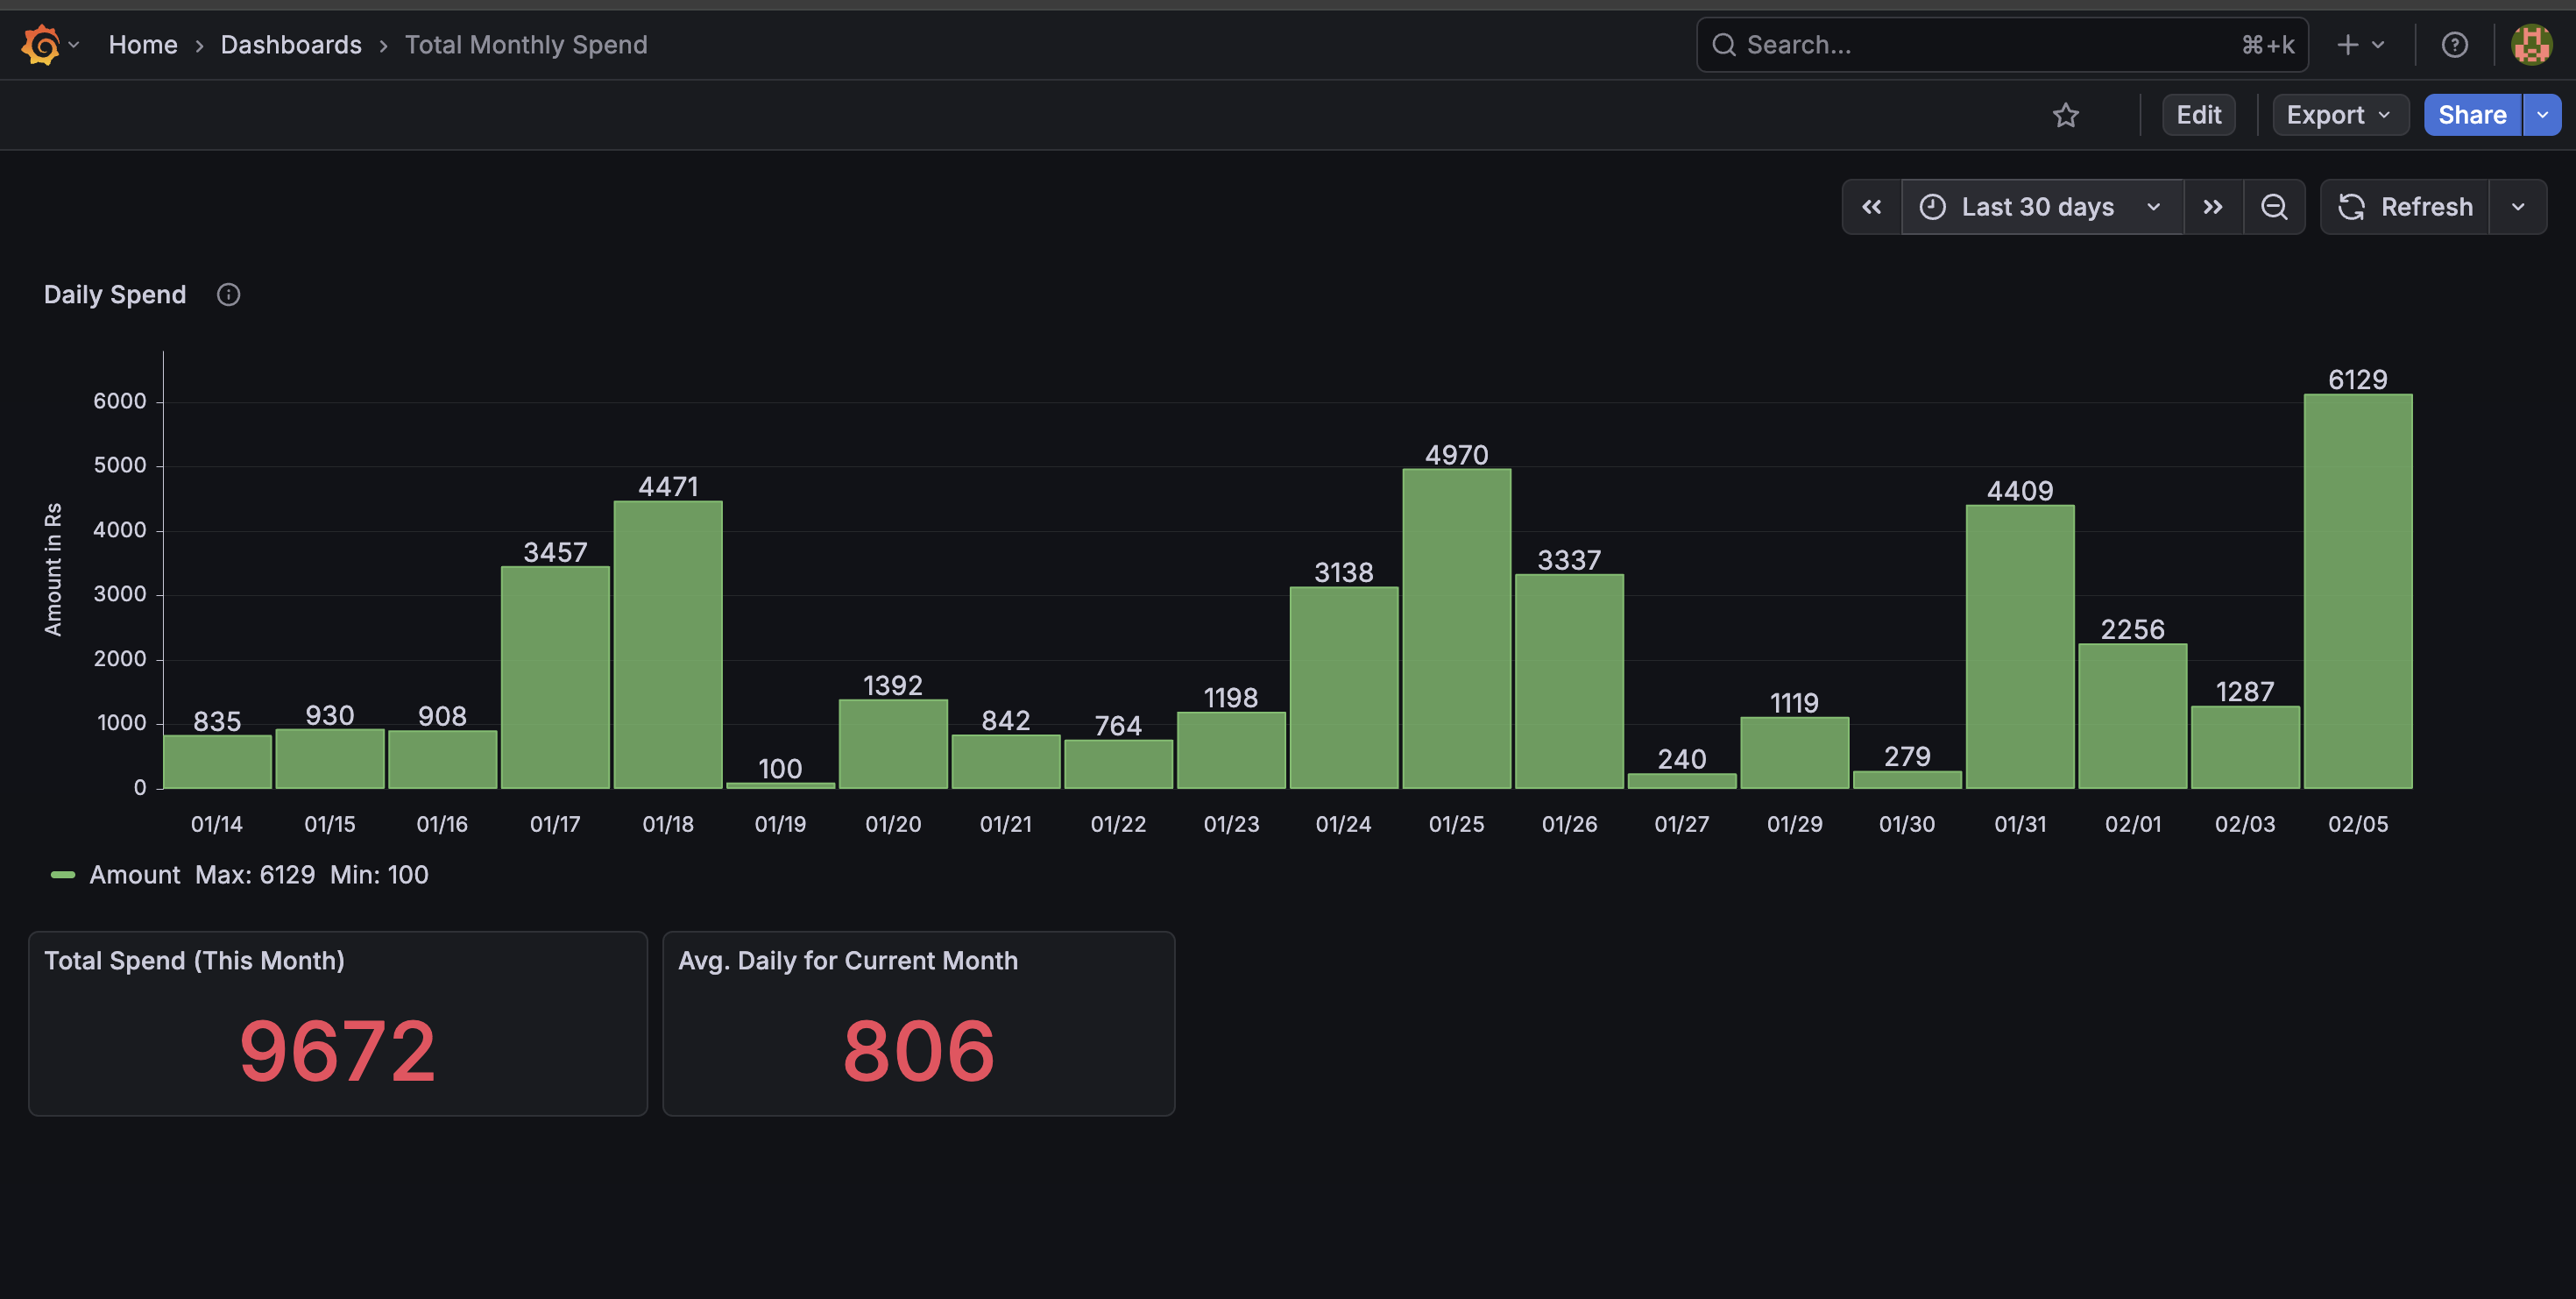
Visualizing with Grafana
This is where everything comes together. Dashboards include:
-
Daily spend bar chart
-
Total spend today
-
Month-to-date spend
-
Merchant-wise breakdown
-
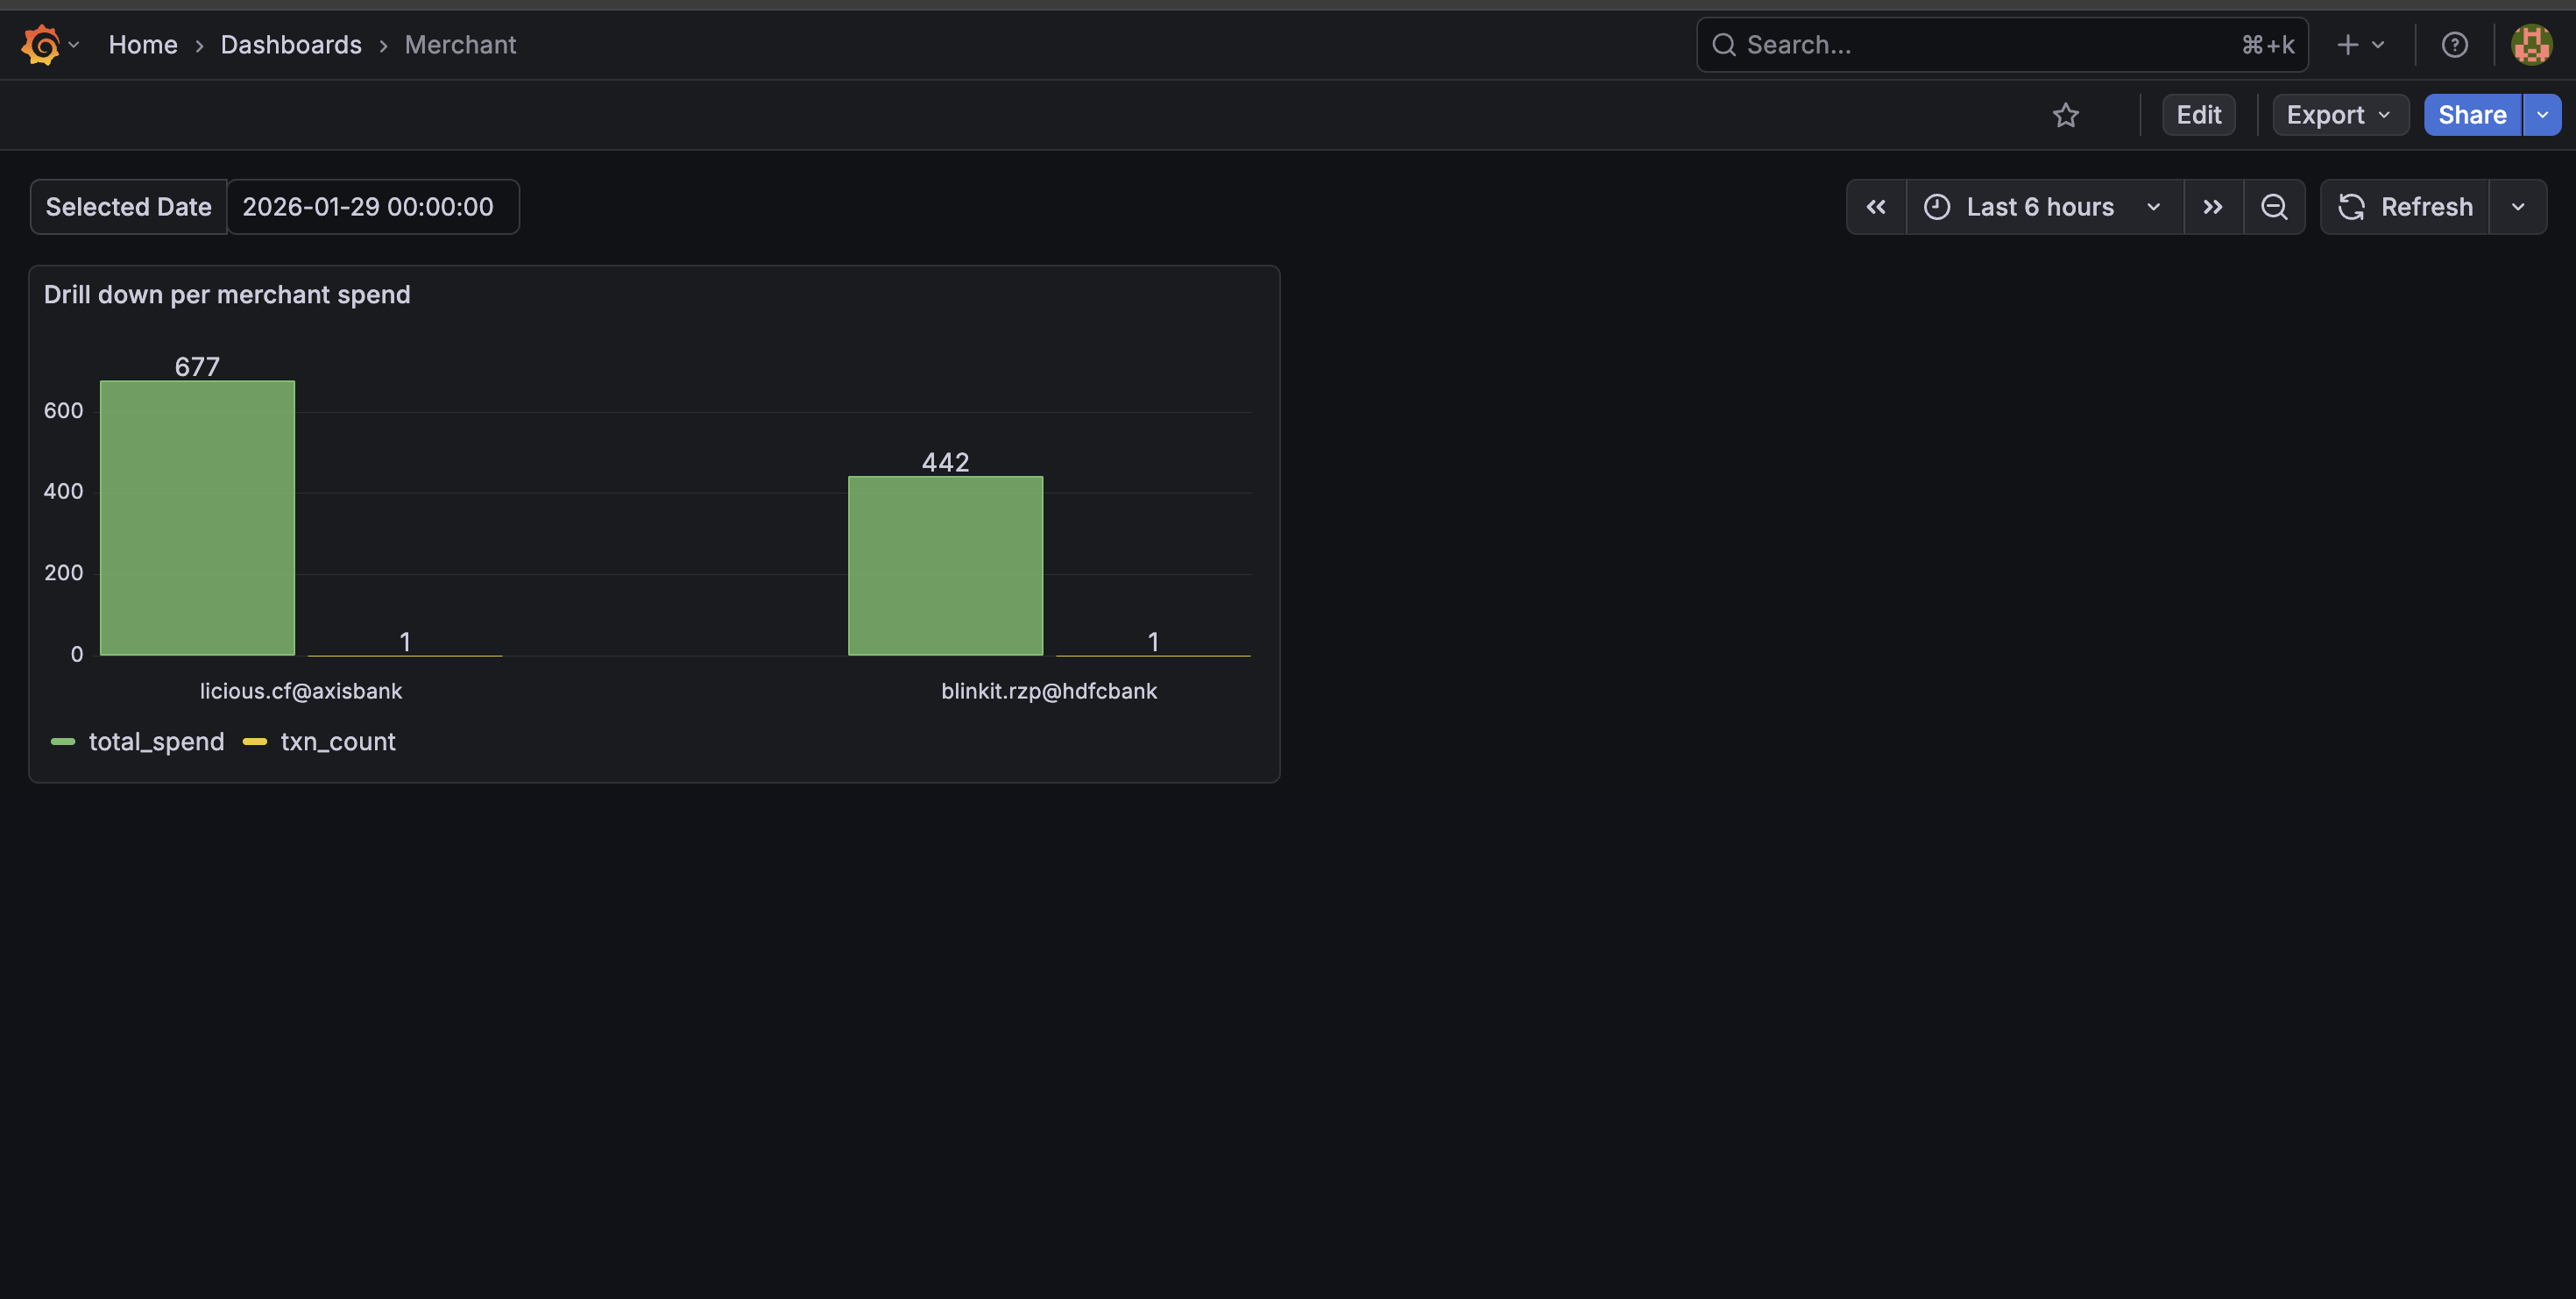
Drill-down Feature (My Favorite Part)
Clicking on a day lets me:
- Drill down into per-merchant spend
Instantly answer:
- Where did my money go on this specific day?
This makes the dashboard interactive, not just pretty.
What the Dashboard Achieves; With one glance, I can now: Track spending patterns, Identify high-frequency merchants, Notice anomalies immediately ,Make more conscious spending decisions. And most importantly: I actually use this dashboard daily.
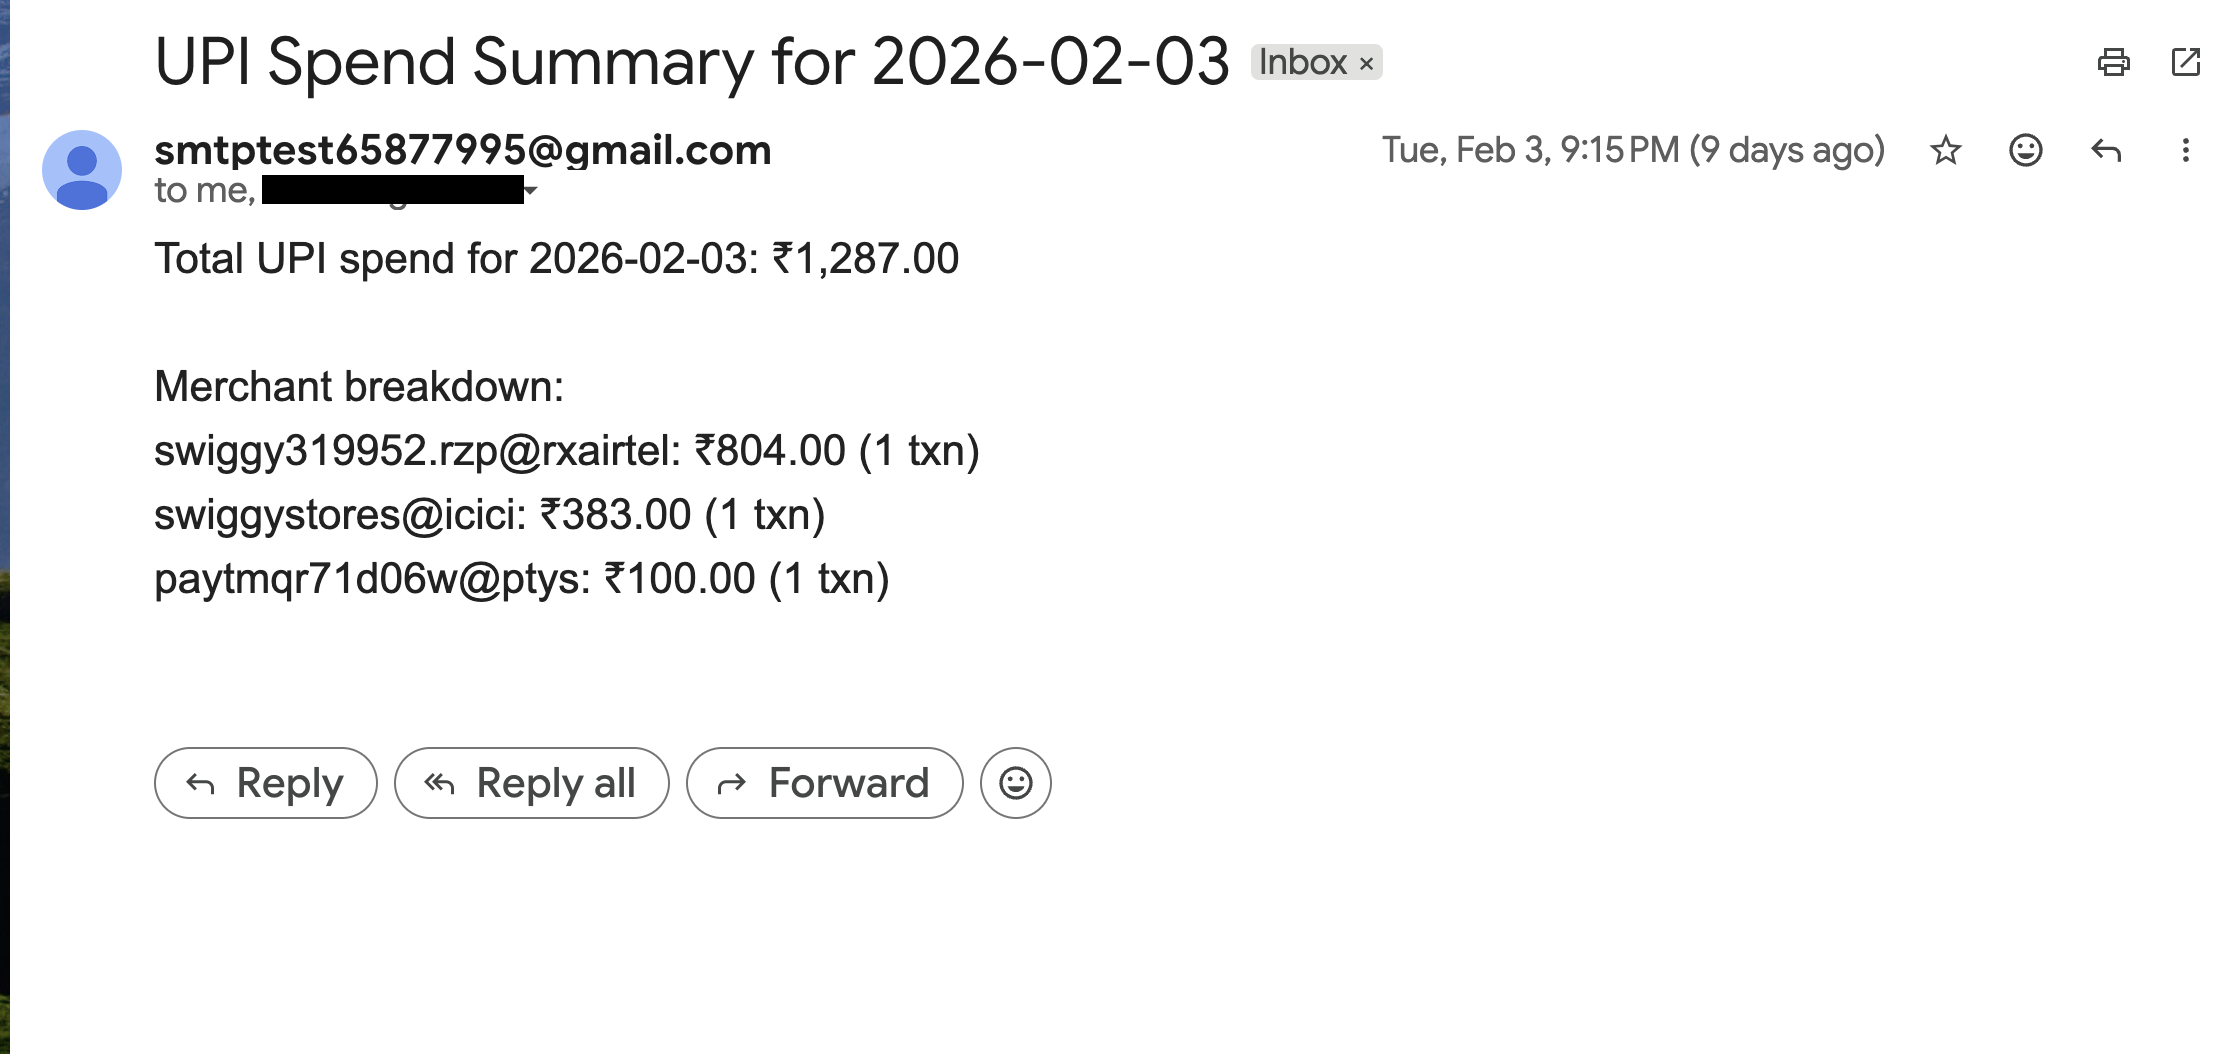
Daily 9:15 PM Spend Summary Email
Dashboards are useful — but they require you to open them. So I added a daily automated spend summary email that goes out every night at 9 PM to me and my wife. A scheduled job: Queries ClickHouse for total spend of the day, Generates a merchant-wise breakdown, Sends a clean summary via Gmail API. This turned the system from a passive dashboard into a proactive financial awareness tool. Now, instead of checking manually, we automatically get a concise snapshot of our daily spending.
Work in Progress: Available Balance via Kafka
One feature I’m actively building: Real-time available balance tracking, balance change events produced to Kafka, Consumers update balance state, Grafana panel shows live available balance. This introduces: Event-driven architecture, Streaming instead of batch, Stateful processing
Still WIP — but intentionally so.
What I Learned from This Project
This project touched almost every layer:
-
OAuth & APIs
-
Secure networking (DNS, TLS, reverse proxy)
-
Data ingestion pipelines
-
Parsing messy real-world data
-
Columnar analytics databases
-
Visualization & drilldowns
-
Event-driven design (Kafka)
But the biggest takeaway:
The best projects come from solving your own problems. This was built because I needed it — and that made all the difference.